
With the Chancellor making further updates to government spending plans and the health service facing crisis on several fronts, there is uncertainty over what the future will hold for health care finances amid such instability. 
_logo.svg.png) As the new Chancellor faces a dilemma over whether to cut back spending to reassure febrile markets, government spending departments are bracing themselves for some deep scrutiny of their budgets.
As the new Chancellor faces a dilemma over whether to cut back spending to reassure febrile markets, government spending departments are bracing themselves for some deep scrutiny of their budgets.
In terms of spending, the Department of Health and Social Care is the largest department – and the second-largest area of all government spending, after welfare spending. As such, it can expect its funding to be examined closely. Since 1979/80, the Department’s budget has grown four-fold in real terms, and it has doubled its share of the GDP pie. Planned spending between the current year 2022/23 and 2024/25 will add a further £13.2 billion in cash – although rising prices will cut this to around £2.4 billion.
But while the NHS needs more each year merely to stand still in the face of rising prices, it also needs more simply to cope with changes in the population. Changes in the size of the English population – which has grown by 10.6 million since 1979 – mean that spending per person has not grown as fast as the total spend.
And it’s not only the population head count that has changed. So too has its demographic structure. In particular, the number of older people has grown, both in absolute terms and also as a proportion of the total population.
This has been most noticeable in the growing numbers of people aged 85 and over, who now make up around twice the proportion of the population compared to just 30 years ago. Over the same period, the proportion of the population aged 20 to 24 has shrunk by more than a fifth.
These changes make a significant difference to the demands put on the health care system, as someone in their mid-to-late eighties on average consumes around 10 times as much hospital-based care as someone in their early twenties.
Using estimates of the costs of hospital-based care for different age groups, our analysis shows that, on average, health care spending per person in England grew by around 2.6% a year in real terms between 1979/80 and 2020/21, after these changes in the demographic structure are taken into account. This excludes spending in 2020/21 ringfenced for Covid-19.
That 2.6% represents the available resources for the NHS over and above that which would be needed to keep up with inflation, population growth and the increasing health needs of an ageing demographic. It therefore gives an indication of what has been available to the NHS to do more than stand still: to improve the quality of care; adopt new treatments, drugs and technologies; reduce risk; and meet rising patient and public expectations.
As can be seen from the chart, this average increase has not been spread evenly. The last 40 years can be characterised as a period of increases averaging 2.1% in the 17 years prior to 1997, followed by 13 years of much higher growth, averaging 5.7% a year between 1997/98 and 2009/10.
But in the decade leading up to the pandemic, real-terms spending increases per head averaged just 0.4% a year and included four years in which spending per head actually fell. This has been a period of stagnation in terms of the resources available to the NHS to fund improvements in health care quality, or to expand its horizons of what it is possible to do for patients.
NHS funding
Our commissioning budget for 2022/23, excluding drawdown of previous years’ surpluses, is £153 billion. We are responsible for using this money wisely, fairly and transparently to secure the best possible outcomes for both patients and the taxpayer.
We allocate most of this funding – £107.8 billion – for commissioning local health services. A further £29.8 billion is spent on directly commissioning services including some primary care services, specialised services and public health. The remaining funds are allocated to the delivery of service development and improvement programmes, in line with our corporate priorities, and NHS England’s core administration and programme costs.
Figure 1 below, shows how we distribute our mandate funding.
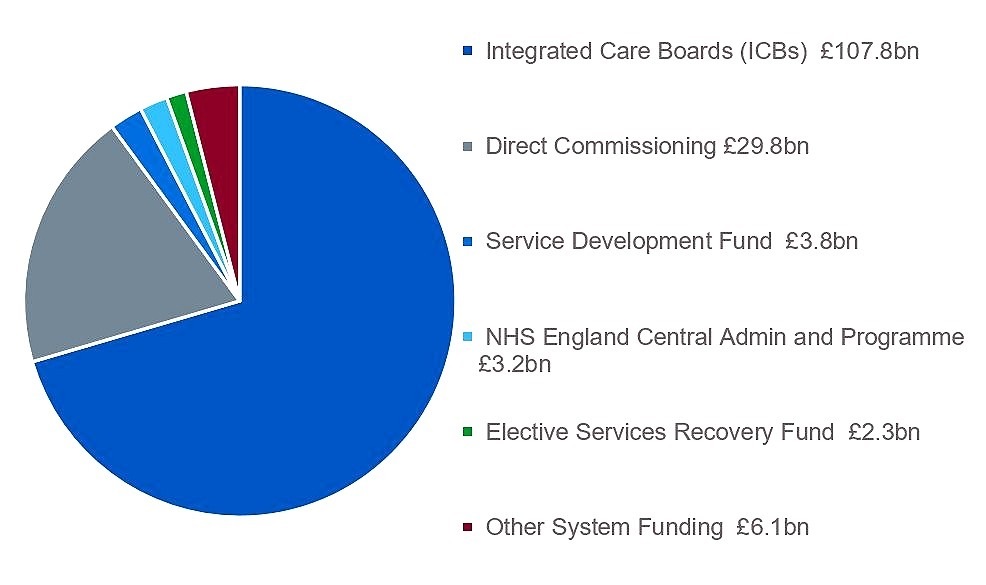
Mandate funding – accessible textIntegrated care boards (ICBs) £107.8 billion
Direct commissioning £29.8 billion
Service development fund £3.8 billion
NHS England central admin and programme £3.2 billion
Elective services recovery fund £2.3 billion
Other system funding £6.1 billion (other system funding includes £3.4 billion for increased employer pension contributions).
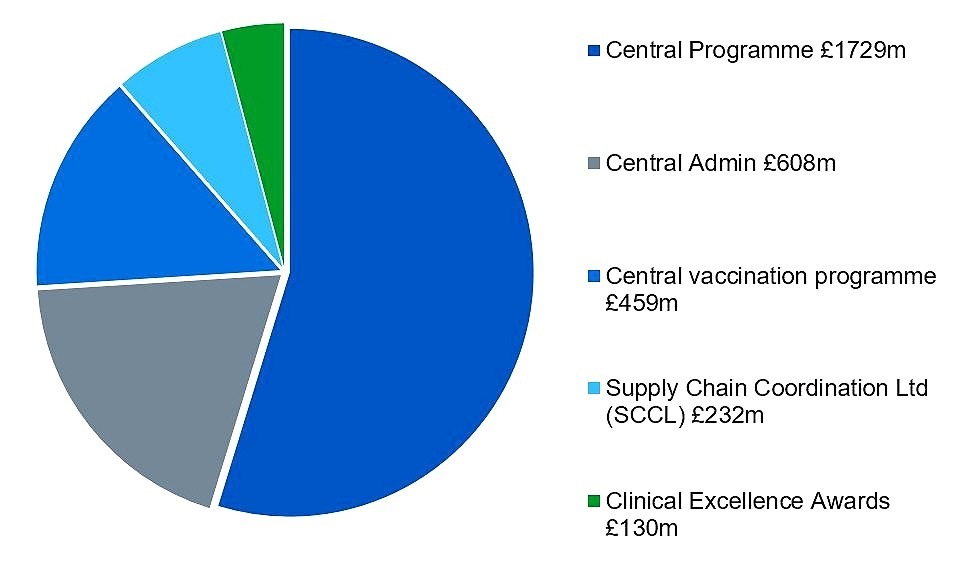
The central administration budget for NHS England in 2022/23 has been set at £608 million. Our programme costs are focused on the delivery of our corporate priorities and this year we have a funding envelope of £2.5 billion. Approximately £0.13 billion is allocated to pass-through costs to fund clinical excellence awards. This leaves £2.4 billion (excluding £0.1 billion depreciation) for direct investment by NHS England to deliver on the commitments outlined in this business plan.
Figure 2: 2022/23 NHS England central admin and programme funding (£3.158 million)
 Central admin and programme funding (£3,158 million) – accessible text
Central programme £1729 million
Central admin £608 million
Central vaccination programme £459 million
Supply chain coordination ltd (SCCL) £232 million
Clinical excellence awards £130 million
Note: This funding includes £3.4 billion for employer pension contributions.

How much is this government really spending on the NHS per person given rising demographic pressures, and how does this compare historically?
In terms of spending, the Department of Health and Social Care is the largest department – and the second-largest area of all government spending, after welfare spending. As such, it can expect its funding to be examined closely. Since 1979/80, the Department’s budget has grown four-fold in real terms, and it has doubled its share of the GDP pie. Planned spending between the current year 2022/23 and 2024/25 will add a further £13.2 billion in cash – although rising prices will cut this to around £2.4 billion.
But while the NHS needs more each year merely to stand still in the face of rising prices, it also needs more simply to cope with changes in the population. Changes in the size of the English population – which has grown by 10.6 million since 1979 – mean that spending per person has not grown as fast as the total spend.
And it’s not only the population head count that has changed. So too has its demographic structure. In particular, the number of older people has grown, both in absolute terms and also as a proportion of the total population.
This has been most noticeable in the growing numbers of people aged 85 and over, who now make up around twice the proportion of the population compared to just 30 years ago. Over the same period, the proportion of the population aged 20 to 24 has shrunk by more than a fifth.
These changes make a significant difference to the demands put on the health care system, as someone in their mid-to-late eighties on average consumes around 10 times as much hospital-based care as someone in their early twenties.
Using estimates of the costs of hospital-based care for different age groups, our analysis shows that, on average, health care spending per person in England grew by around 2.6% a year in real terms between 1979/80 and 2020/21, after these changes in the demographic structure are taken into account. This excludes spending in 2020/21 ringfenced for Covid-19.
That 2.6% represents the available resources for the NHS over and above that which would be needed to keep up with inflation, population growth and the increasing health needs of an ageing demographic. It therefore gives an indication of what has been available to the NHS to do more than stand still: to improve the quality of care; adopt new treatments, drugs and technologies; reduce risk; and meet rising patient and public expectations.
As can be seen from the chart, this average increase has not been spread evenly. The last 40 years can be characterised as a period of increases averaging 2.1% in the 17 years prior to 1997, followed by 13 years of much higher growth, averaging 5.7% a year between 1997/98 and 2009/10.
But in the decade leading up to the pandemic, real-terms spending increases per head averaged just 0.4% a year and included four years in which spending per head actually fell. This has been a period of stagnation in terms of the resources available to the NHS to fund improvements in health care quality, or to expand its horizons of what it is possible to do for patients.
Looking forward beyond actual spending as reported in the government’s accounts to planned spending from 2021/22 to 2024/25, core spending (excluding Covid) is set to rise to provide an average annual increase of around 2.1% per person, after adjusting for changes in the population (and based on our inflation projections).
This will provide more headroom for improving quality and new medical developments than over the last decade, but will still only bring the average annual increase between 2009/10 and 2024/25 to 0.5%. This is far below the long-run average of 2.6%, and comes against the backdrop of the health service trying to recover from a pandemic.
We now have a period of intense speculation and uncertainty over the direction the government will take on public spending and taxation. Every spending department will put forward its own case, and the trade-offs between different forms of public spending are, as always, difficult decisions to make. Decisions about public spending are, of course, also political. The table below shows how adjusted spending per head has changed over time by political party.
The waves of generosity and austerity partly reflect the stripe of the party in power, prevailing economic conditions, and other factors shaping governments’ choices.
As we reach another decision point for the coming years, we can expect it to influence and shape the health service we have – not just tomorrow, but for a decade or more to come.
We now have a period of intense speculation and uncertainty over the direction the government will take on public spending and taxation. Every spending department will put forward its own case, and the trade-offs between different forms of public spending are, as always, difficult decisions to make. Decisions about public spending are, of course, also political. The table below shows how adjusted spending per head has changed over time by political party.
Changes in health spending per capita, adjusted for demographic changes
| Time period, political party | Average annual change in per capita health spending (adjusted) |
| 1979–1997, Conservatives | +2.03% |
| 1997–2010, Labour | +5.67% |
| 2010–2015, Con/Lib coalition | -0.07% |
| 2015–2021, Conservatives | -0.03% |
| 2021–2024, Conservatives – committed spend | +2.05% |
As we reach another decision point for the coming years, we can expect it to influence and shape the health service we have – not just tomorrow, but for a decade or more to come.
Our commissioning budget for 2022/23, excluding drawdown of previous years’ surpluses, is £153 billion. We are responsible for using this money wisely, fairly and transparently to secure the best possible outcomes for both patients and the taxpayer.
We allocate most of this funding – £107.8 billion – for commissioning local health services. A further £29.8 billion is spent on directly commissioning services including some primary care services, specialised services and public health. The remaining funds are allocated to the delivery of service development and improvement programmes, in line with our corporate priorities, and NHS England’s core administration and programme costs.
Figure 1 below, shows how we distribute our mandate funding.
Mandate funding – accessible textIntegrated care boards (ICBs) £107.8 billion
Direct commissioning £29.8 billion
Service development fund £3.8 billion
NHS England central admin and programme £3.2 billion
Elective services recovery fund £2.3 billion
Other system funding £6.1 billion (other system funding includes £3.4 billion for increased employer pension contributions).
The central administration budget for NHS England in 2022/23 has been set at £608 million. Our programme costs are focused on the delivery of our corporate priorities and this year we have a funding envelope of £2.5 billion. Approximately £0.13 billion is allocated to pass-through costs to fund clinical excellence awards. This leaves £2.4 billion (excluding £0.1 billion depreciation) for direct investment by NHS England to deliver on the commitments outlined in this business plan.
Figure 2: 2022/23 NHS England central admin and programme funding (£3.158 million)
Central admin and programme funding (£3,158 million) – accessible textCentral programme £1729 million
Central admin £608 million
Central vaccination programme £459 million
Supply chain coordination ltd (SCCL) £232 million
Clinical excellence awards £130 million
Note: This funding includes £3.4 billion for employer pension contributions.
Comments
Post a Comment